lineboi3000 is an Electron-based app I built to control an Axidraw pen plotter. A plotter is, in a nutshell, a robot that holds a pen. Generally you can move the pen on the X and Y axes of a 2d field, like a piece of paper, as well as moving the pen’s position up or down, to where the pen is touching the paper or whatever media you’re using. So, between pen up, pen down, and move pen, you have yourself a drawing robot.
Much of the pen plotting work I encountered was more algorithmic in nature, where you write some code (for example, in Processing) to generate imagery that you can then send to a pen plotter. I wanted to be able to start from a basis of drawing things freehand, and when I wasn’t able to find an app or project that fit my needs I decided to code my own. This was the biggest and most involved app I’ve ever personally built, and I learned quite a bit from it, but best of all, at the end I had built the tool I wanted to exist.
To see the project, code, as well as full documentation, check it out on Github.
The Basics
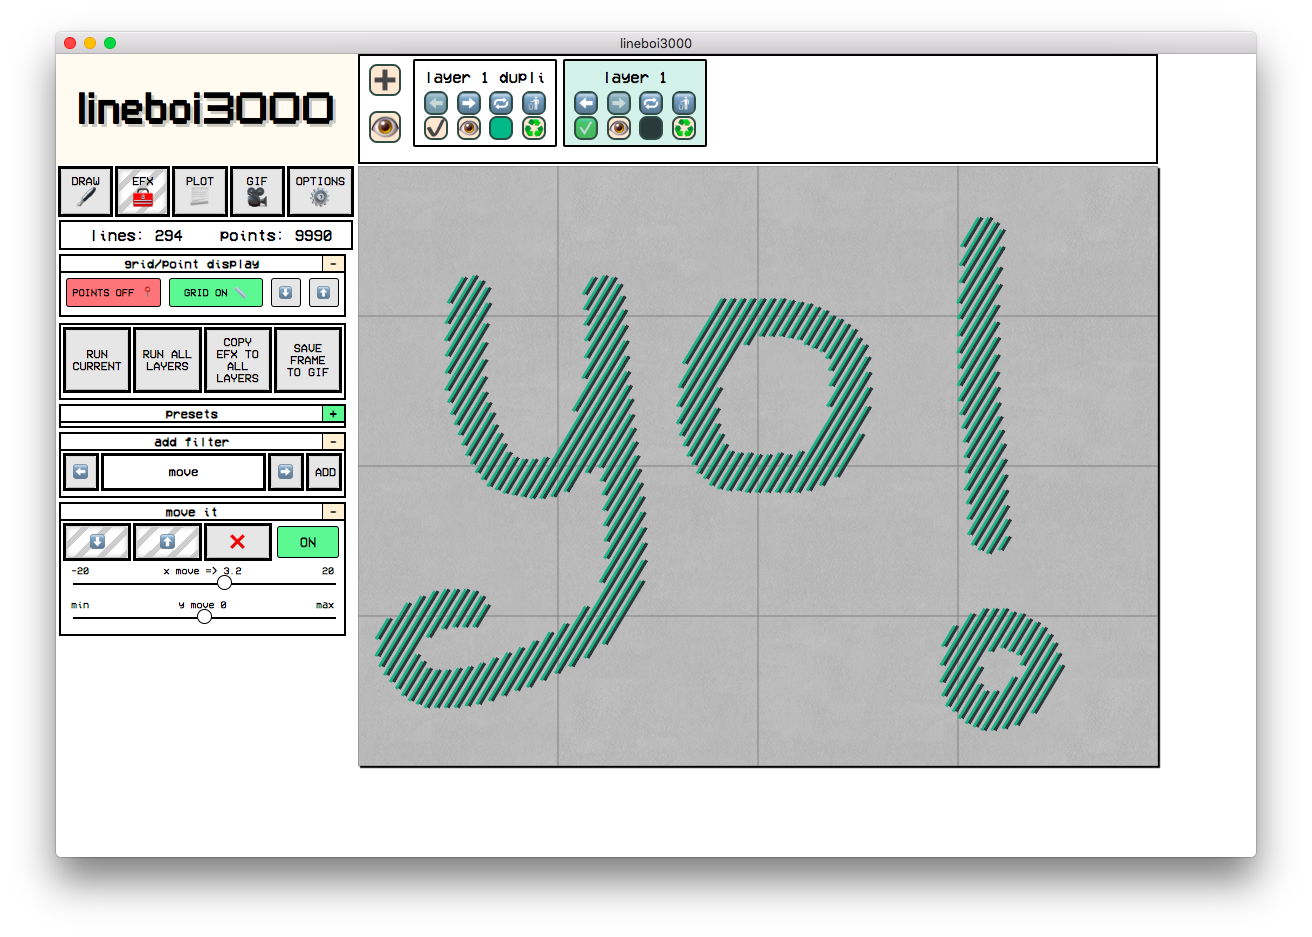
Here’s the main UI for lineboi3000:
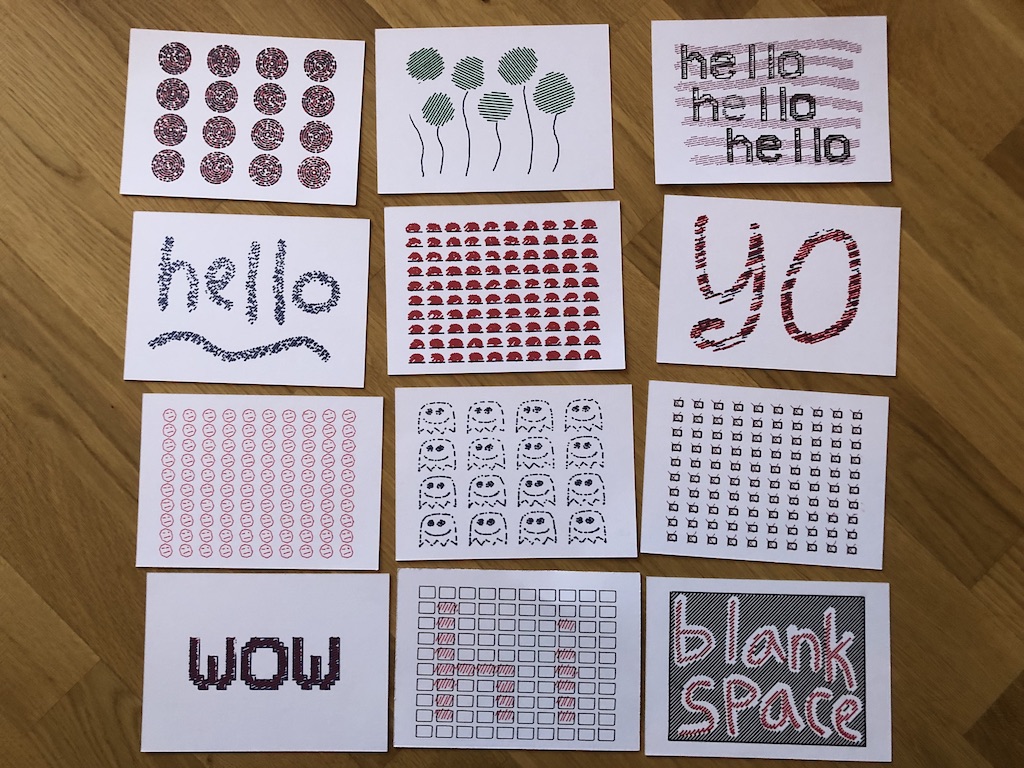
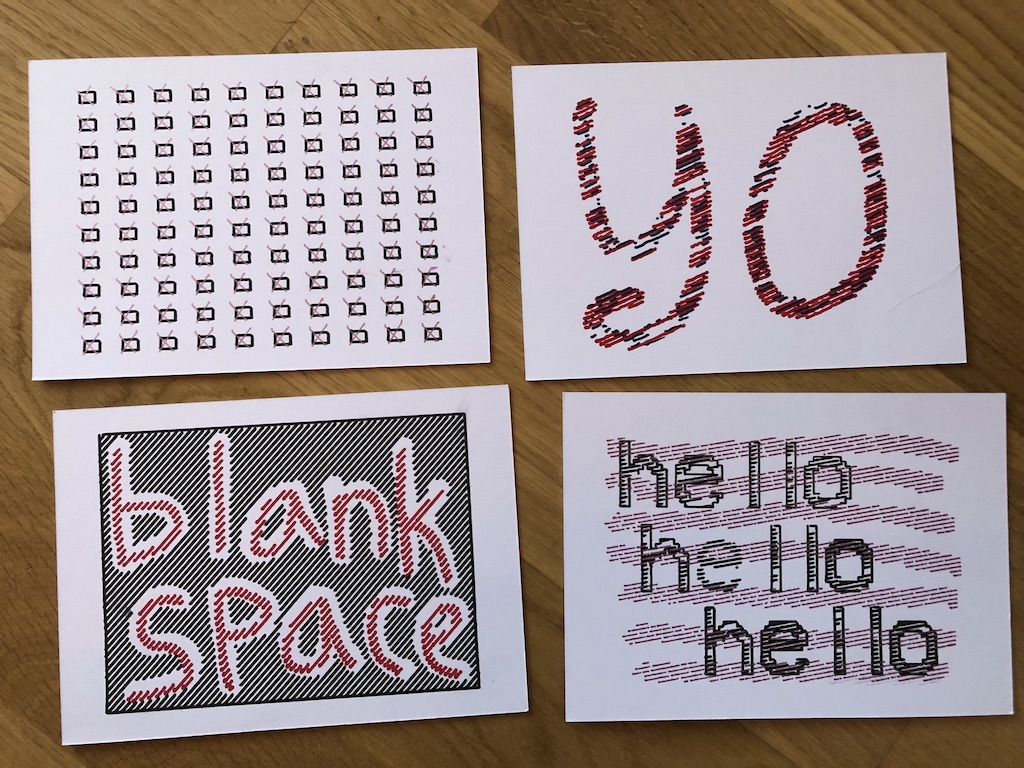
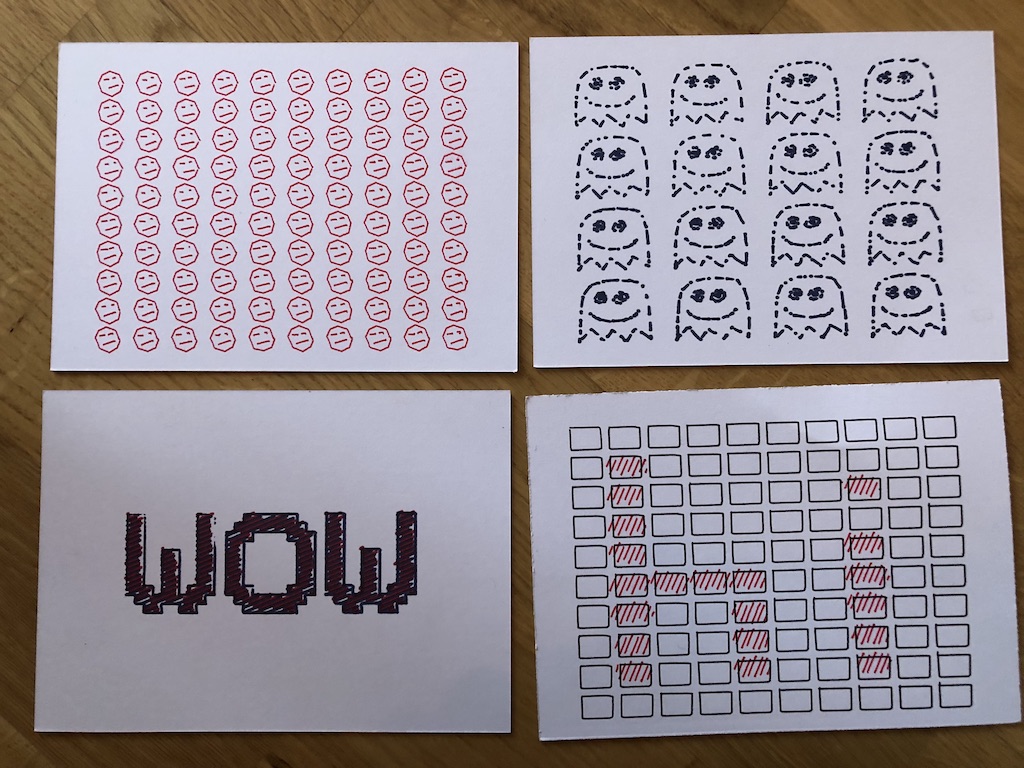
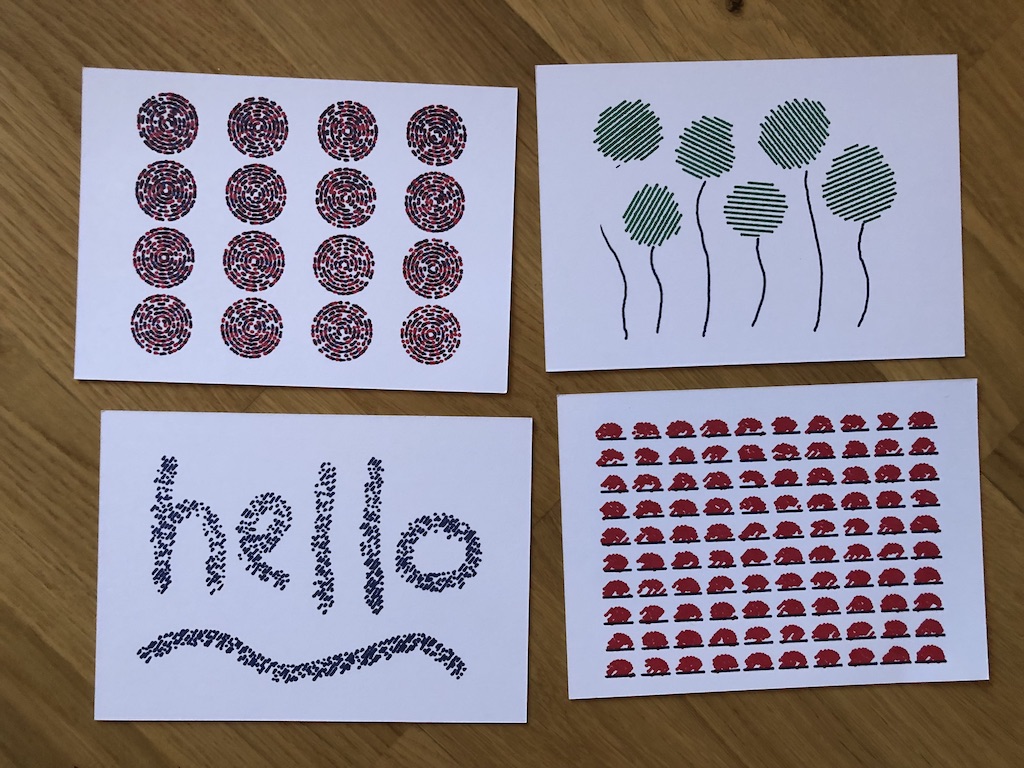
And here are some examples of postcards I created entirely with lineboi3000 and an Axidraw pen plotter. These were sent to recipients all over the world as part of a plotted artwork exchange I participated in, run by members of the wonderful #plottertwitter community on Twitter. I’ve drawn hundreds of postcards using lineboi3000 at this point, both for strangers and as gifts for friends and family, and it feels great to be working within a tool I built myself to solve my own problems.
Walk The Line
There are a million drawing apps out there, but my goal was to build something that worked with a pen plotter, which means there’s one very specific limitation: the only options you have are moving the pen to given X/Y coordinates, and then raising and lowering the pen. This means that any pen plotted artwork can be represented by a set of instructions: move to a given set of X/Y coordinates, lower the pen, move to other X/Y coordinates, raise the pen, and repeat. So my app needed to work within these restrictions, so that anything the user can see on their screen can be converted directly to a physical drawing using a pen plotter. This means that anything created within lineboi3000 is just a set of lines, which are in turn made up of an array of X/Y coordinates.
Effects
The main goal I wanted to accomplish here was the marriage between “by hand” drawing and computer assistance. In other words, I wanted to draw things, and then use the power of computers to make them look cooler. This is where “efx” (effects) come in. Generally, since the entire thing can be expressed in terms of lines made up of X/Y coordinates, the effects simply act on these X/Y coordinates to make cool designs. For example, moving each X/Y coordinate by a randomized amount, or deleting every other coordinate in a line, or connecting the end of every line to the beginning of the next line to get a design that can be drawn without picking the pen up.
In the screenshots above, the examples where the same small image is repeated 30 or 50 times on a postcard are a good example of this. The workflow is to draw one small ghost or happy face, then multiply it until it fills the entire desired area, and then applying effects to the whole thing. By adding a nature of randomization to the effects, you can easily have 50 or 100 similar but slightly different images filling your drawing area. The subtle differences allow for a more handmade and natural look, even though you only had to draw the initial design once.
Tech Learnings
The number of lines in a given project can get quite high, which means a decent amount of computation power and time can be required to add effects. I set up a Web Worker to perform these calculations, so the main UI thread remains unblocked even when lots of calculations are happening. When the user starts effect calculation, a “loading” icon is set on the main UI, the lines and effect parameters are sent to the appropriate Web Worker, and once the calculations are finished the Web Worker sends them back to the main thread, the loading icon is removed, and the updated lines are shown within the app.
My initial idea was to use an SVG-based approach to drawing the lines in the app, but it turns out that the overhead of having hundreds or thousands of individual SVG elements within the DOM can slow an app down quite a bit. The reason for SVG was to have individually addressable lines, which could then (for example) be highlighted in a different color when they were being plotted. Since the SVG approach turned out to be too slow, I switched to a purely HTML canvas approach. Once the line calculations are finished in a separate thread on a Web Worker, they’re sent back to the main app and printed directly to the canvas. Canvas is generally very fast to draw on, so the danger of blocking the main thread even when drawing tens of thousands of lines is relatively low.
If I had to do this project over, I would very likely use TypeScript. One of the bigger struggles I ran into was keeping track of the types and shapes of data I was passing around. Lots of arrays of arrays (and even some arrays of arrays of arrays) were used to represent the lines, coordinates, and groups the user can create within the app, and it was sometimes difficult to keep track of the exact shape of data I needed. TypeScript would have helped by allowing for well-defined interfaces and compiler warnings to let me know when I was going one level too deep into an array, or not deep enough, in a given function.